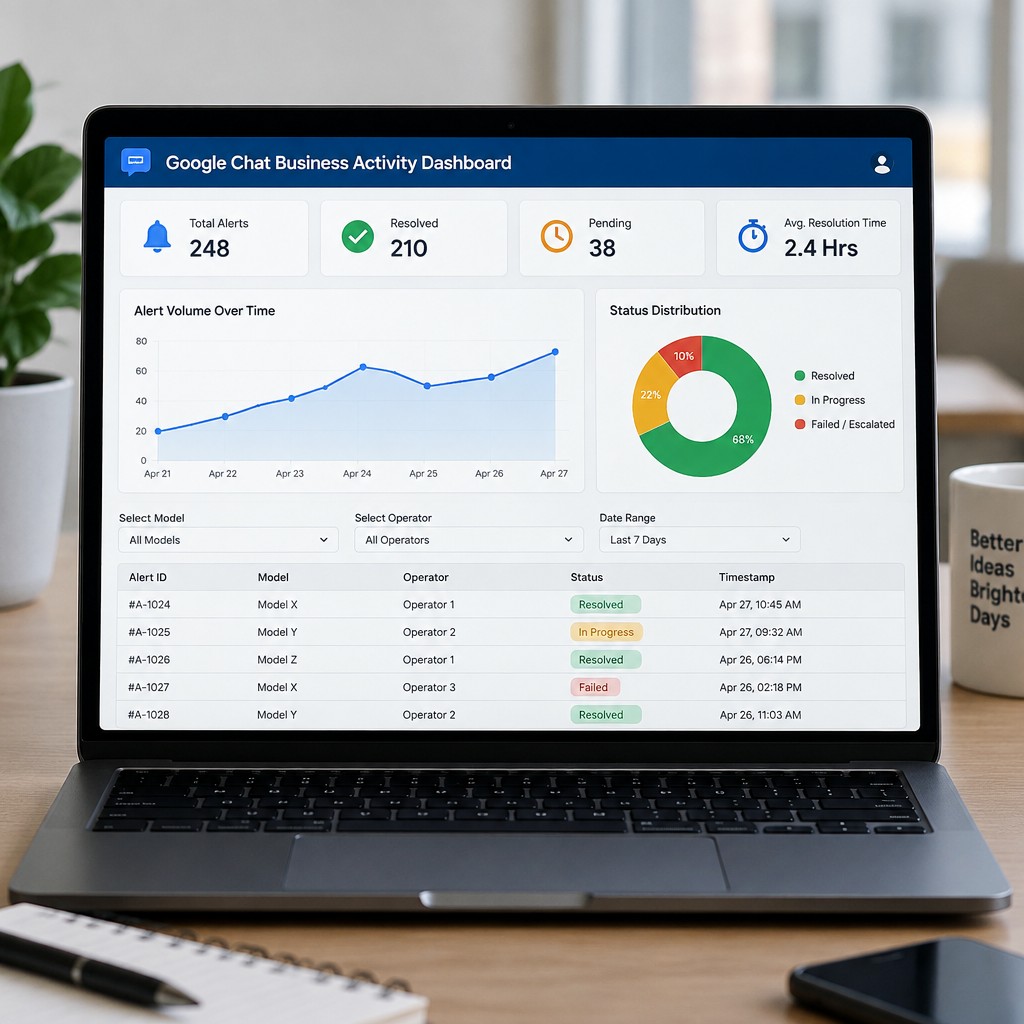
AI-generated mockup
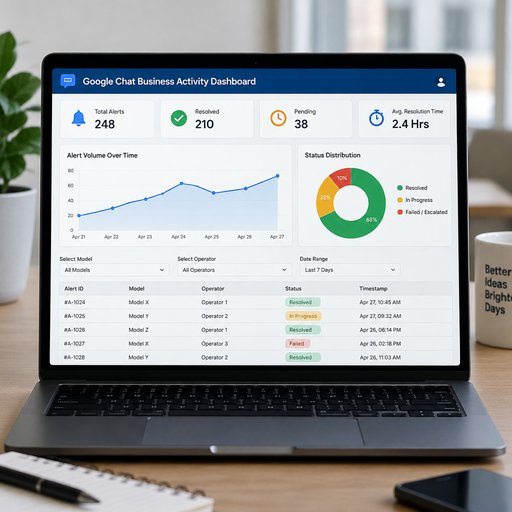
Overall Style: Background: Light gray or off-white (clean, modern SaaS look). Color Palette: Dark blue (primary), light blue, green, and orange (for alerts/statuses). Top Bar: A simple dark blue header with the title: "Google Chat Business Activity Dashboard" and a small profile icon on the right. Row 1: Key Performance Indicators (KPI Cards) Four rectangular cards across the top, each with a small icon and a large number: Total Alerts: 248 (Icon: Bell) Resolved: 210 (Icon: Green checkmark) Pending: 38 (Icon: Orange clock) Avg. Resolution Time: 2.4 Hrs (Icon: Timer) Row 2: Visualizations (The Core Charts) Left Side (Large Chart - 60% width): A line or area chart titled "Alert Volume Over Time" showing a trend line over the last 7 days. This represents your "real-time visualization" aspect. Right Side (Smaller Chart - 40% width): A donut or pie chart titled "Status Distribution" showing three sections: Resolved (Green), In Progress (Yellow), Failed/Escalated (Red). Row 3: Data Table & Filters (The "Google Sheets" Integration) Top of Row 3: A filter bar with drop-down menus labeled: "Select Model", "Select Operator", and "Date Range". Bottom of Row 3: A simple data table with a few rows showing the extracted data from your NLP pipeline. Columns: Alert ID | Model | Operator | Status | Timestamp (e.g., #A-1024 | Model X | Operator 1 | Resolved | 10:45 AM)
November 19, 2026
More dashboard mockups